HLAB27Pred
HLAB27Pred Stepwise Help
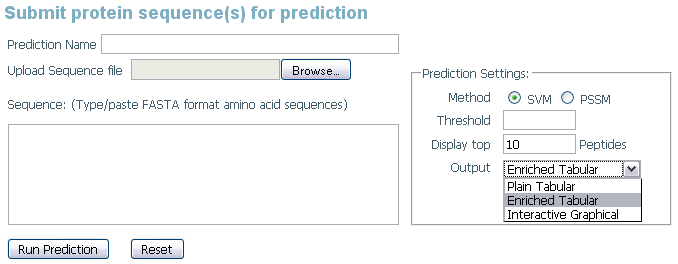
• Sequence Submision:
Users can select either of the ways to submit their sequences for prediction. They can either upload a file containing single or multiple sequences, or they can key in (paste) the sequence in the given text area. Whatever option selected, the sequence must be in the FASTA format.
• SVM predictions:
While performing the SVM classificaiton each amino acid nanomer peptide gets a SVM score. RBF (Radial Bais Function) Kernel from SVM_Light (@ bhaiya: shall we add reference to svm-light here???) has been implemented for the purpose of training of this server and the classificaiton of user sequence(s).
• PSSM predictions:
This methods uses the position specific information of the experimentally proven binding peptides. A Position Specific Scoring Matrix (PSSM) has been created based on the binding peptides data set and is implemented for the prediction of binding or non-binding nanomeric peptides.
• Threshold:
User can set the threshold above which nanomeric peptides would be considered as binding epitopes. The major advantage of using a default or custom threhsold is to refine the results and to set up a limit beyond to that only a pepride would be considered. By Default it is 0.4 and 0.62 for SVM and PSSM respectively. These default values have been observed while performing several analysis during the development of server. If you wish to have more confidence or high specificity in the prediction, we recommend setting higher threshold values. This system considers values upto 4 places of decimals.
• Prediction result
Results from this server are displayed in 3 different user-friendly text formats, as
1. Plain tabular
2. Enriched tabular
3. Interactive graphical
All the three format persents information in different forms. Screenshots for all the fromats are attached below. Enough efforts have been made to keep all the results simple and self explanatory.
The Plain tabular format displays only the sequence submited by the user and the predictions made by this server in a tabular form.
The Enriched tabular format additionaly displays a summary table containing several crucial detials that might be of interest to the users.
The Interactive graphical format also displays a grpah. This graph is a function of prediction score layed against the sequence composition. Clicking over this graph will open a new window which is an enlarged version of the same thumbnail.
• GraphsThe graphs are generated for the sequence submitted by the users to this server for prediting the binding and non-binding nanomeric peptides. These graphs are the function of prediction score (SVM or PSSM) plotted against the sequence composition. As are part of Interactive graphical display format, these graphs will help the users to understand the proper threshold that they should select in order to accomodate possible binding peptides.
The red horizontal line in the graph represents the threshold level selected. If no threshold is selected, this line merges with the X-Axis. Thumbnails are given in the normal result display. Upon clicking over this thumbnail will open a magnified graph in a new browser window.