
To evaluate the results obtained by the WB-DEGS we used two synthetic dataset. The first one is the well knows Latin square produced by Affymetrix chips on human (HGUAI33A) [2]. This data set includes 14 samples each of three replicated microarray oligonucleotides give a total of 42 experiments .The second one present a new wholly defined spike-in dataset consisting of 18 microarrays [3].
Import Data
There are several data warehouses for transcriptome data. The main ones are Gene Expression Omnibus (GEO) of NCBI, the EBI ArrayExpress and the Stanford Microarray Database (SMD). From the database EBI, it will load both dataset. To analyze ,the raw data must be downloaded in the same directory of the script that we have created for our analyzes.
WB-DEGS Gene Selection
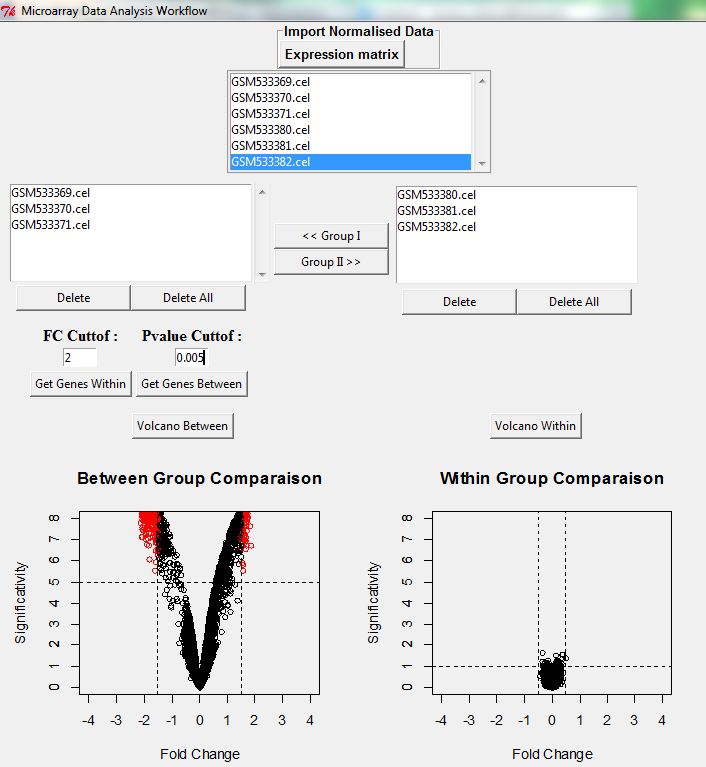
The first step consists to import the Gene Expression normalized matrix. As example, we choose the Latin Square (E-GEOD-17968). We select three replicates treated and three replicates Control. The Fold change and the P_values are fixed in the next step (For example FC=2 & P_value =0.005).
The results are represented in two volcano plots, the first one represents between group comparisons, where the significance correspond to the average (-log10 P values) across all the between comparison and the SLR obtained from average fold change; the second one represented the within group comparisons with the same statistics. These last comparisons give a good estimation of noisy background signal, and if this noise is very low then scatter points representing genes stand around 0.
Part of gene list generated :
Gene |
Pvalue |
FC |
1622896_at |
4.35923498258667e-08 |
2.49914907891425 |
1622899_at |
3.75857451202262e-08 |
2.92603997129701 |
1622908_a_at |
3.19243331216664e-09 |
-3.26215126190338 |
1622939_at |
2.33881797253994e-05 |
2.12689563056365 |
1622950_a_at |
6.86081944495601e-08 |
2.35164389359336 |