In this part we describe the development of a WB-DEGS that deals with the selection of DE gene. This algorithm is well suited for experiments with very large amount of background noise. WB-DEGS aimed to improve the specificity of the selection procedure.
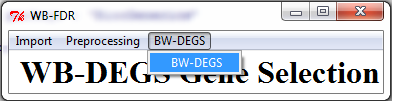
Select it in the main window >> WB-DEGS
Upon selecting BW-DEGS, the main menu bar appears:
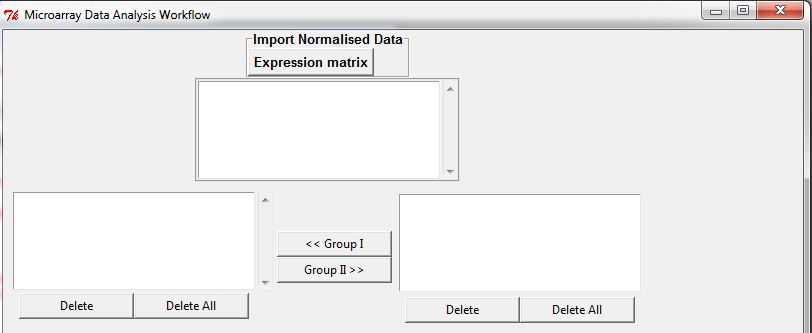
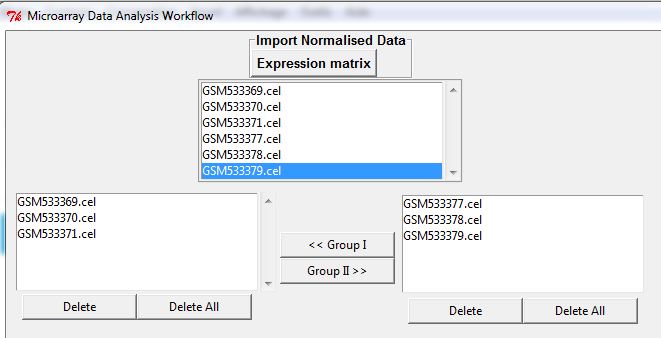
Once the import matrix gene expression is filled with the names of the files .Cel used, simply select the two groups. In this context two type of comparison will be made;
To evaluate the significance of genes, it is interesting to compare the value of the fold change that gives the direction of stimulating gene, and the significance that quantifies the importance of this direction (p_values).
Please choose the FC Cuttof and P_value Cutoff:
The volcano plot arranges genes along two axes represent statisticalsignificance and biological significance. The first dimension is the Signal Log Ratio, obtained from Fold Change between two groups. The second axis represents the P_value or more precisely, the change P_values that quantified the significance of the change between the samples.
Two volcano plots are obtained.
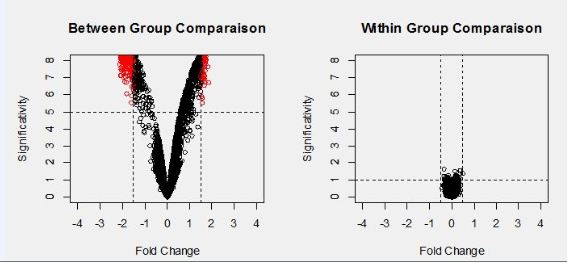
Volocano Plot within comparison Measure the background noise between the replicas. Indeed, the genes which appear with a significant modulation inform about the experimental noise present. In fact, when the noise is insignificant, volcano plot is reduced to the point cloud around the origin (0, 0). On the contrary when the noise is significant, the noise may be comparable to the signals stimulated genes, and subsequently these genes are missing in the noise. For this raison the use of between and within group’s comparison give a list of the most significant gene.