Hands-On
This is a step-by-step tutorial to show how this application works and how to fully use it for analysing microarray data (2 groups conditions).
Data Upload
To load CEL files, click on Choose Files.
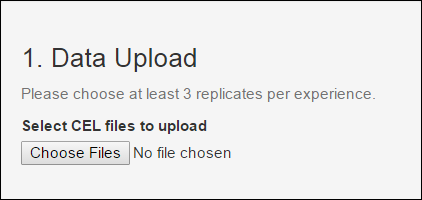
The long of this hands on, we will be using as example data, 6 CEL files from \the Platinum Spike experiment dataset (GSE21344), available on the web link: http://www2.ccr.buffalo.edu/halfon/platinum_spike/platinumspikedownloads.html.
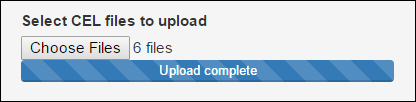
After selecting the Cel files, a progress bar indicates that the data upload is complete:
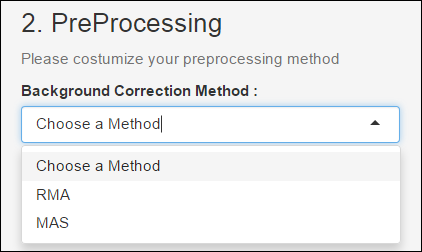
Preprocessing Data
The following preprocessing operations can be performed using WB-DEGS:
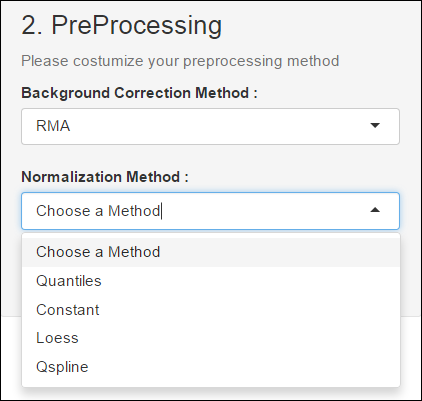
Background Correction Method
A first preprocessing step is the Background Correction. The idea behind the Background Correction is that the fluorescence of the spot is the effect of summation between the fluorescence of the Background and the fluorescence due to labeled mRNA .Thus the theory goes, in order to obtain the values proportional to the amount of mRNA, one needs to subtract the values corresponding to the Background. In this context, we used the RMA and MAS methods.
Normalization method
The goal of this step is to align the distribution of the probe intensities in a set of array. In other words, after this normalization all arrays should have the same distribution of their probe intensities. This can be done in several ways; the most used is the quantile normalization.
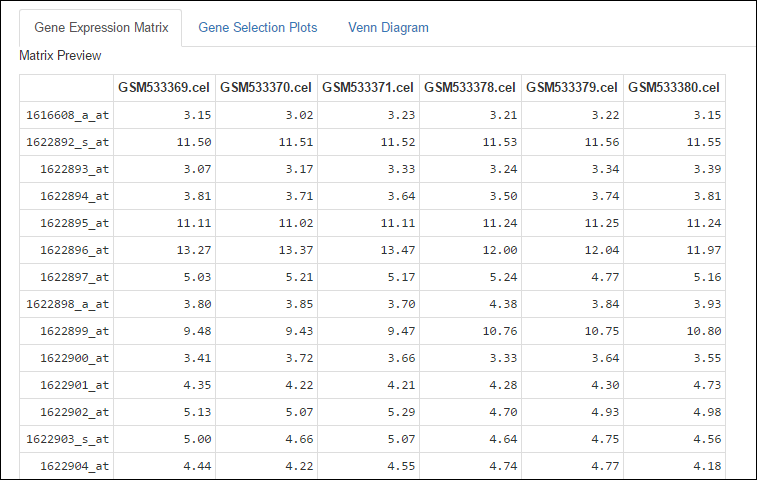
After the preprocessing is done, select the tab Gene Expression Matrix to display a preview of the gene expression matrix generated, and even to download it.
Gene Selection
The goal in this analysis is to detect groups of genes that demonstrate differential expression between two condition groups.
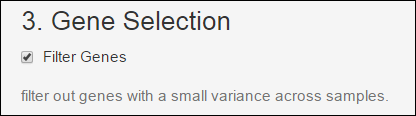
Gene Filter
Can be performed in order to filter out some of the constantly expressed genes, and perform downstream analysis on a smaller informative subset of the genes.
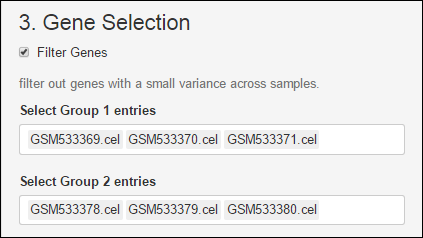
Select Groups
Once the matrix gene expression is filled with the signals of the CEL files used, simply select the two groups.
Group 1: control group.
Group 2: treated group.
Note that, There must be at least 3 samples per group.
Statistical Analysis
For within and Between Group Comparisons, apply a statistical test. WB-DEGS provided several selection methods:
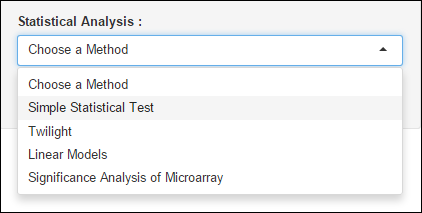
a) Simple Statistical Test (T-test)
When using this method, genes can be assigned into one of two groups (up-regulated and down-regulated), depending on the definitions of t-test parameters.
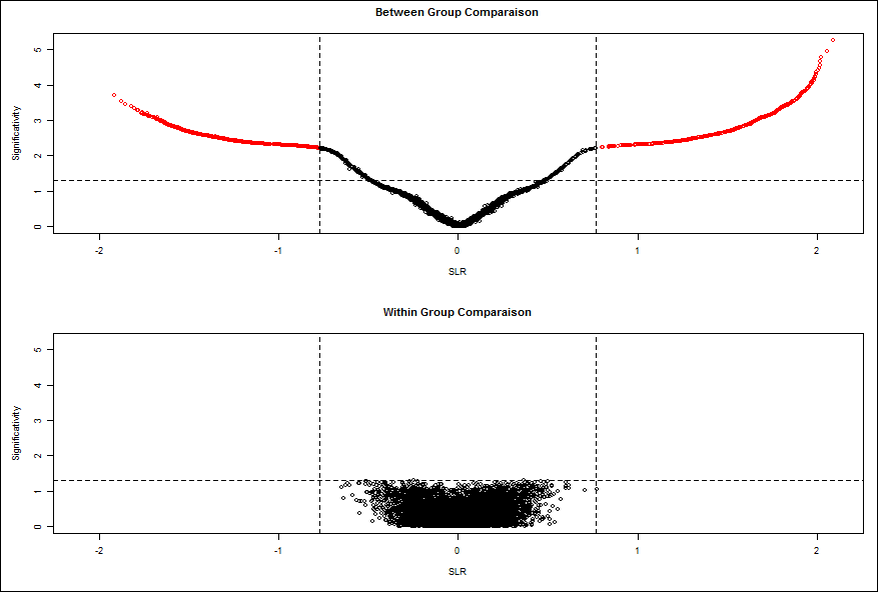
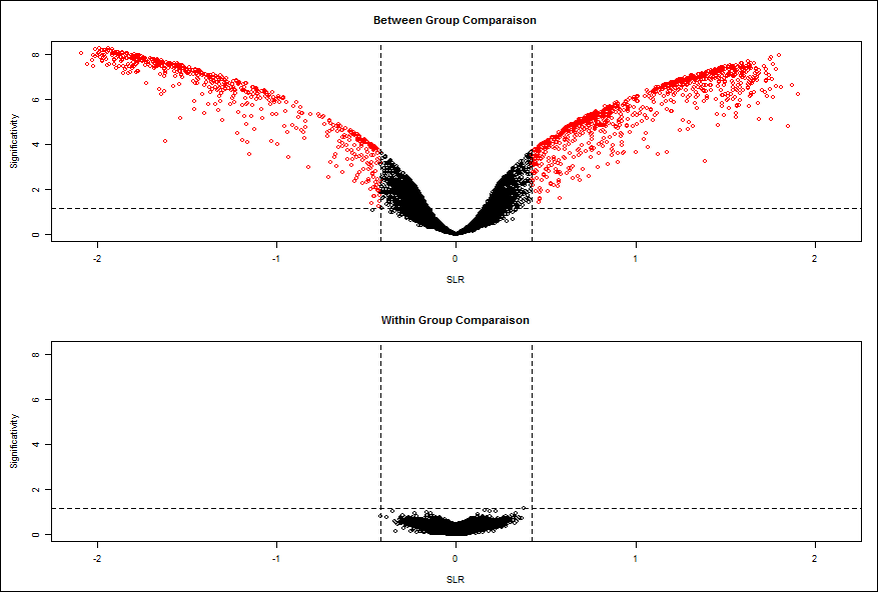
After the selection of simple statistical test, two volcano plots are obtained.
Volcano Plot within comparison Measure the background noise between the replicas. Indeed, the genes, which appear with a significant modulation, inform about the experimental noise present. In fact, when the noise is insignificant, volcano plot is reduced to the point cloud around the origin (0, 0). On the contrary when the noise is significant, the noise may be comparable to the signals stimulated genes, and subsequently these genes are missing in the noise. For this raison the use of between and within group’s comparison, give a list of the most significant gene.
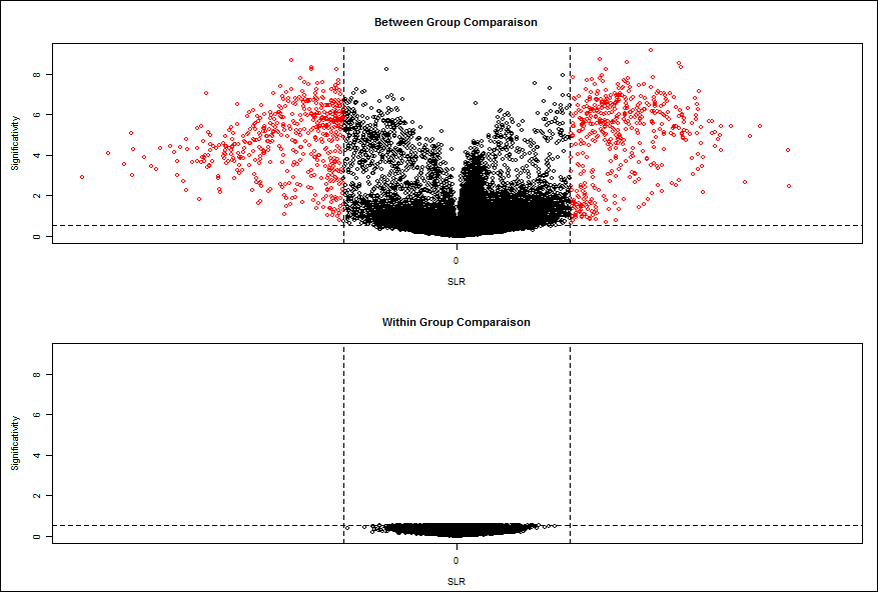
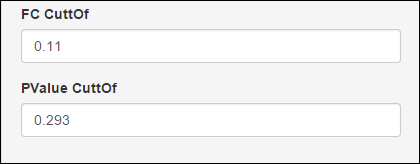
The within comparison volcano Plot allows the selection of genes by setting thresholds of FC Cuttof and Pvalue Cutoff.
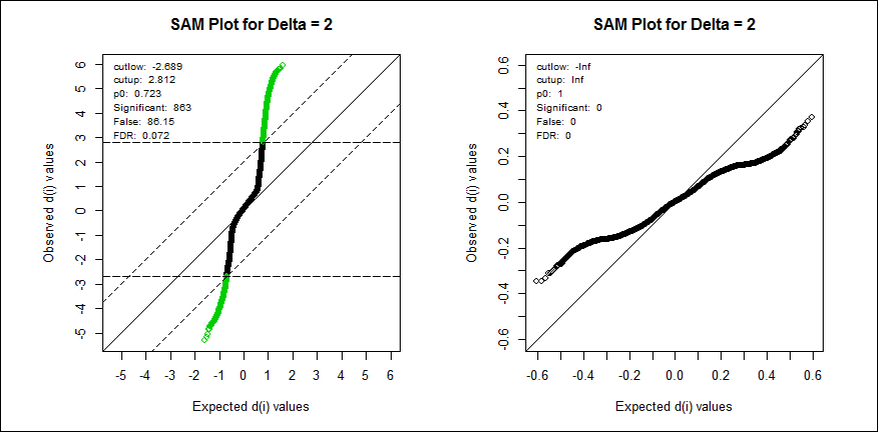
b) Significance Analysis of Microarray (SAM)
This method detects probes that demonstrate differential expression between conditions subsets. The probes are then assigned into two groups (up-regulated and down-regulated) if 2 condition groups are tested or into one group of differentially expressed otherwise. SAM uses permutations to get an ’empirical’ estimate for the FDR of the reported differential genes (for details see the References section.
c) Twilight
Twilight contains two main functions: Function twilight.pval performs a two-condition test on differences in means for a given input matrix or expression set and computes permutation based p-values. Function twilight performs a stochastic downhill search to estimate local false discovery rates and effect size distributions (for details see the References section).
d) Linear Models
Linear Models focuses on the practice of regression and analysis of variance. It clearly demonstrates the different methods available and, more importantly, in which situations each one applies. It covers all of the standard topics, from the basics of estimation to missing data, factorial designs, and block designs.
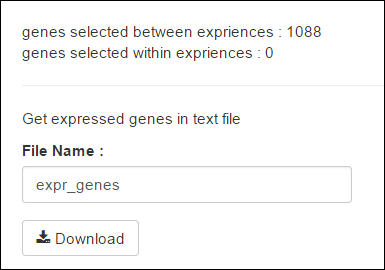
After each statistical analysis, methods can generate a list of genes. The gene list is downloadable (See below the Part of gene generated).
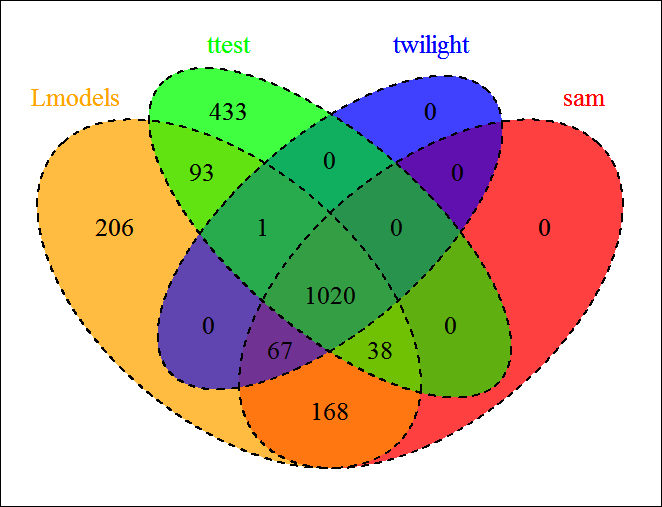
Venn Diagram
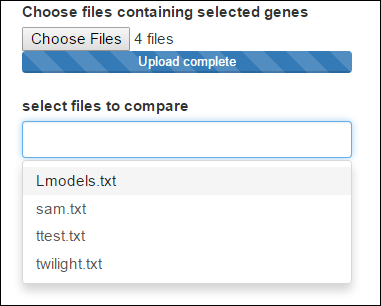
In order to compare the results, we implemented a Venn diagram as optional utility, it accepts the list of genes downloaded in the previous section.

The user can upload as much files as he wants, but he can choose maximum 5 lists to compare. Here we'll select the 4 lists generated from the statistical tests :
The plot will update automatically according to the lists chosen. for the 4 lists, we obtain the plot below.