 ADDGAP is a resource developed after Genetic association studies performed on the genotype data available for Alzheimer's related genes. It consists of of genetic parameters estimated for SNPs, haplotype blocks, linakge disequilibrium, phosphorylation sites and other related information.It serves not only as central information but also a comparative analysis platform. ADDGAP is equipped with intuitive and flexible query interface facilities for better comparative genomic analysis. It helps user to analyze, utilize, and understand the data more effectively.
ADDGAP can be browsed through assorted search options:
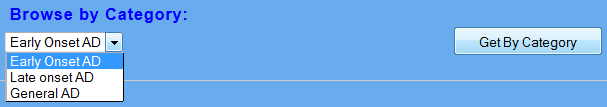
- Browse by Category:
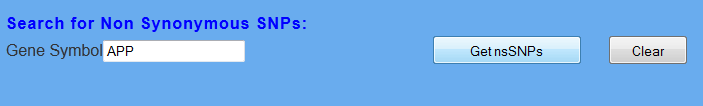
- Search for Non Synonymous SNPs:
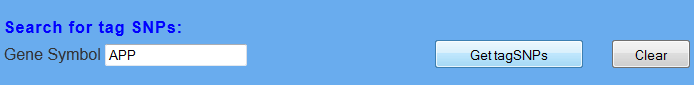
- Search for tag SNPs:
- Search for Haplotypes:
- Search for Linkage Disequilibrium:
- Search for Genetic Marker(s):
- Search for Phosphorylation Sites:
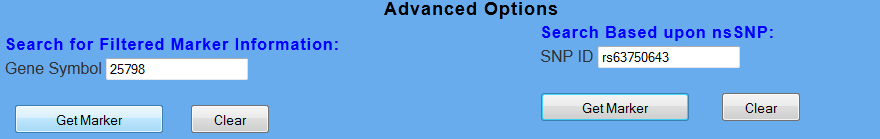
- Search for Filtered Marker Information:
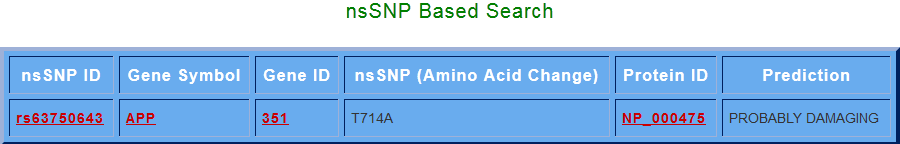
- Search Based upon nsSNP:
Browse by Category:
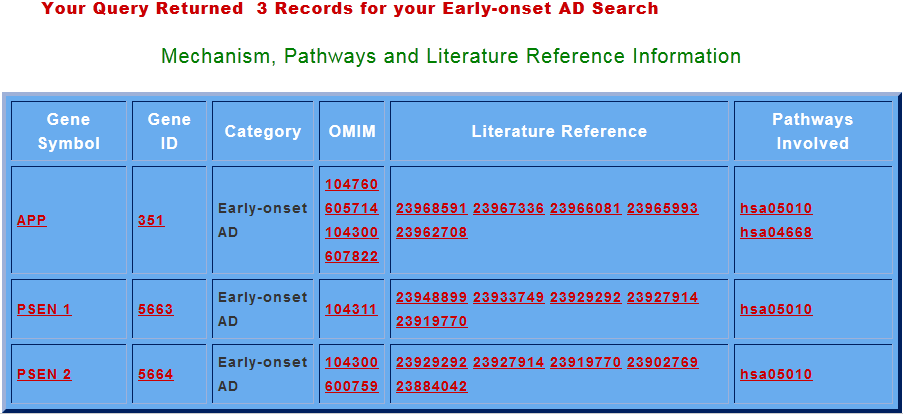
In this search option user can search for any of the three categories and repossess information like all the genes implicated in that category , their Gene ID’s , OMIM ID’s , pathways involved. The appropriate literature references corresponding to AD (for all the prime genes) which are linked to NCBI, OMIM, KEGG and PUBMED databases respectively, are also provided in ADDGAP.
INPUT
OUTPUT
Search for Non Synonymous SNPs and tag SNPs:
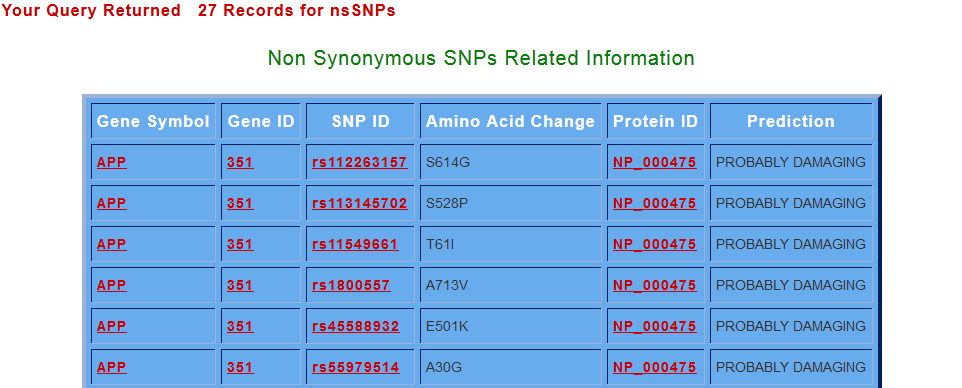
By clicking on search for non-synonymous SNPs button, various ns SNPs for the s elected gene (Gene Symbol) are displayed with their related information. amino acid change column gives the position of the change in the sequence and the amino acid being replaced, while the prediction column shows whether the change is damaging or tolerant to the native protein.
INPUT
OUTPUT
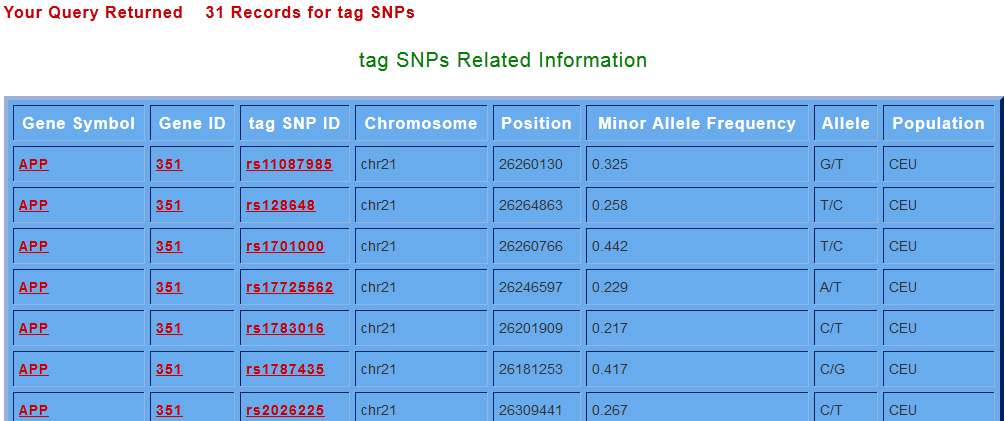
Likewise user can get tag SNPs information for all the prime genes through tag SNPs search option. By clicking on search for tag SNPs button, various tag SNPs for the selected gene are displayed. User can get the informations like the tag SNP ID’s which are linked to dbSNP, with their chromosome number, position, minor allele frequency, allele information (amino acid change) and population from which the tag SNPs data were collected.
INPUT
OUTPUT
Search for Haplotypes and Linkage Disequilibrium:
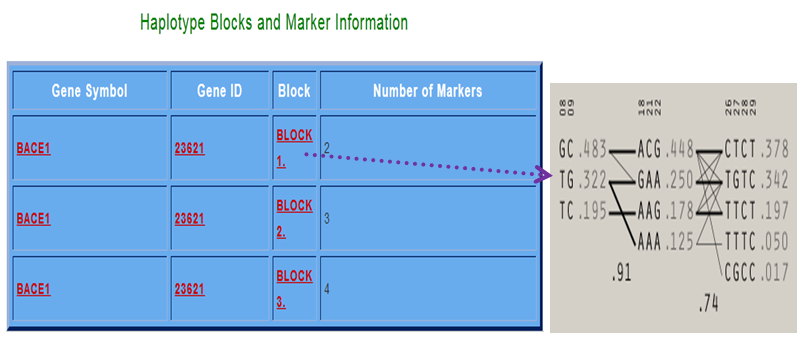
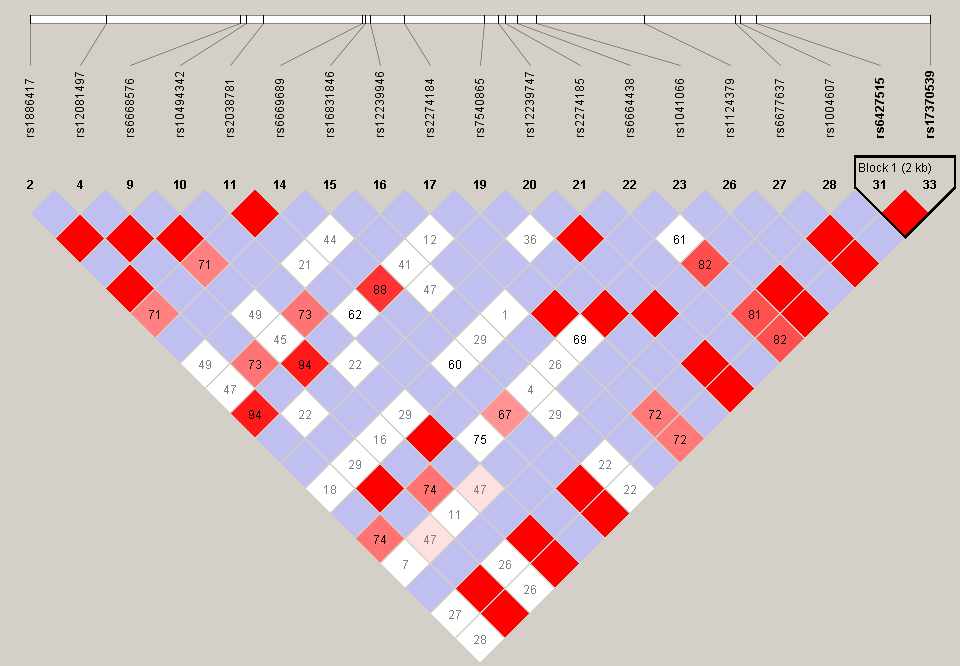
In this search options user can get Haplotypes and Linkage Disequilibrium from ADDGAP based on the unique Gene Symbol's for all the prime genes. These options give the information on essential haplotype blocks and the non-random association of alleles. Consider the case, where we retrieve the haplotypes for Gene Symbol as "BACE1" and click on Get Haplotype button and LD plot for Gene Symbol as "NCSTN" and then click on Get LD option.
INPUT

OUTPUT
The following results will be displayed for the above mentioned queries. There are 3 haplotype blocks found when we searched for the gene BACE1 and block 1 showing 2 markers.
The output for linkage disequilibrium for the gene “NCSTN”, shows the relationship between the two loci's on the basis of the correlation between them where only those loci values has been taken whose r2 (correlation coefficient) value is greater than 0.6. The relationship has been shown in the order of decreasing r2 value.

Search for Genetic Marker(s) and Phosphorylation Sites:
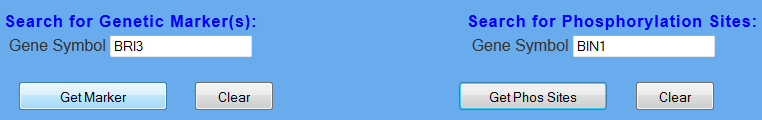
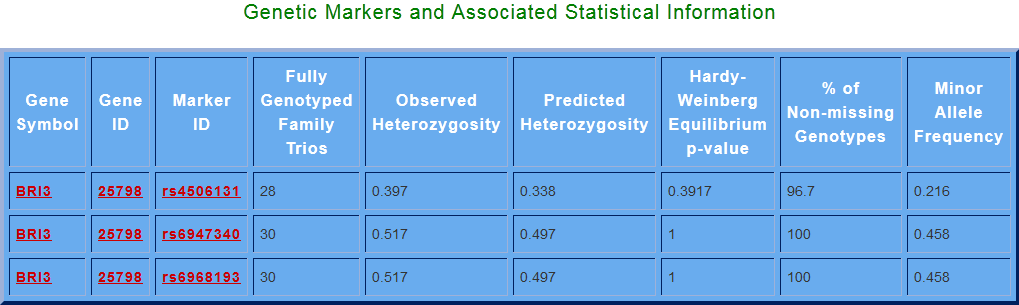
“Search for Genetic Marker(s)” this search option gives us the information about genetic markers and associated statistical information a particular gene, Gene Symbol for that gene can be entered (e.g. BRI3) and then click on Get Marker button. And from the “search for phosphorylation states” option, user can get information for the predicted phosphorylation sites in the AD protein sequences.
INPUT
OUTPUT
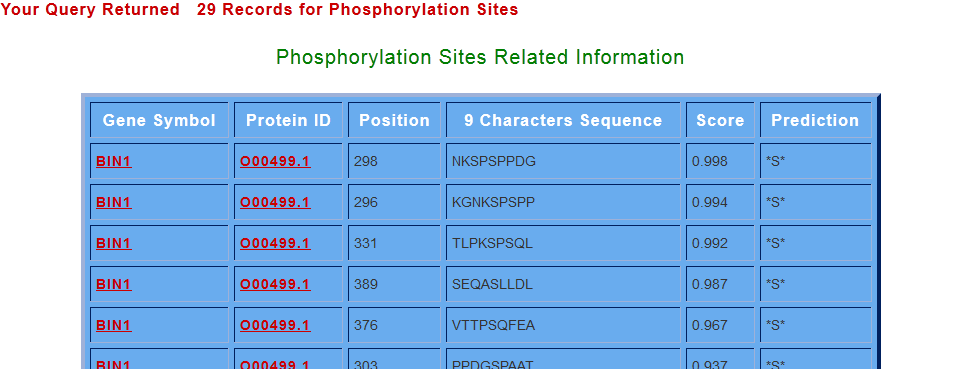
The information includes; the protein ID, location of the phosphorylation site in the sequence, 9 character sequence depicting the phosphorylated residue at the correct center of the sequence, phosphorylation sites having predicted scores more than 0.5 has been selected for potential phosphorylation sites and the prediction column shows the putative phosphorylated residues (S or T or Y). Suppose for the Gene “BIN1”, when user click on the “Get Phos Sites” in the search for phosphorylation sites option, got the following output.
Search for Filtered Marker Information and nsSNP (Advanced Options):
INPUT
OUTPUT